Important note Retirement of icTime and Retirement of biz on December 29th, 2023
Reports: Summary & Analysis
Apart from the Work Log Details (see Reports: Work Log Details), reports provide a summary & analysis section that shows totals under different criteria like teams, users, activity types etc. The summary also has a financial dimension and sums up the total amount of money under different criteria (in case you are working with teams & price lists).
You can hide/display the complete report Summary & Analysis section bei clicking on the arrow/headline.
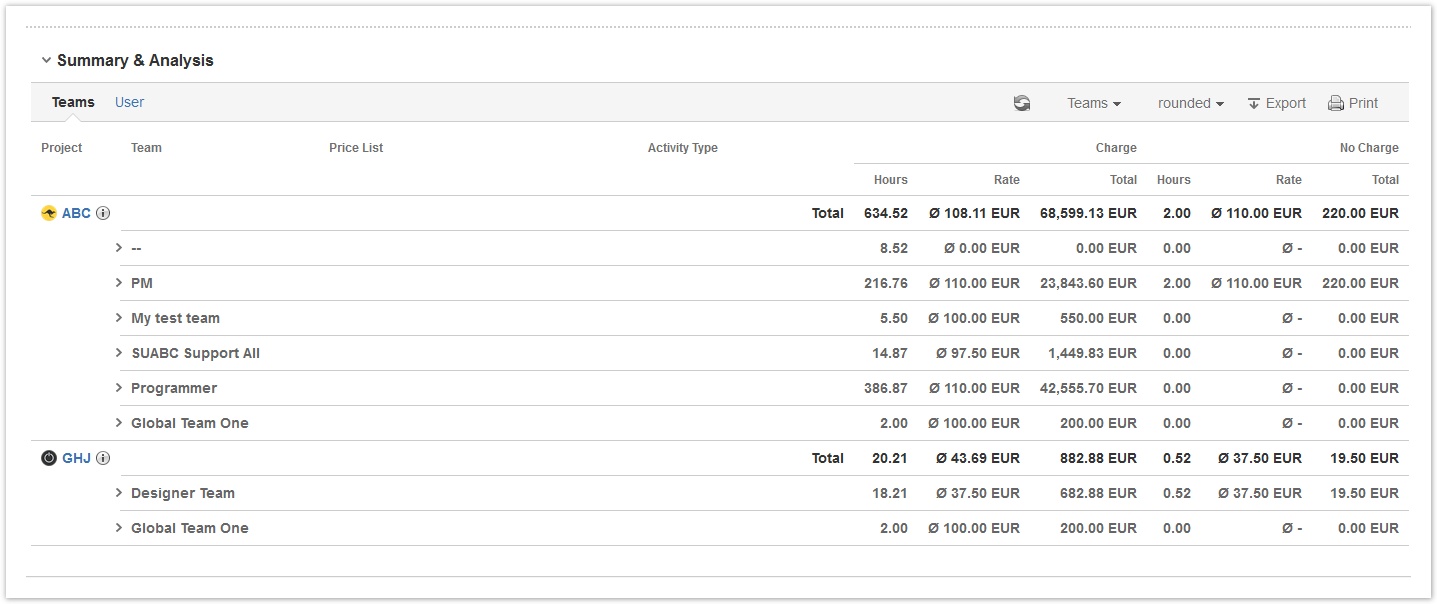
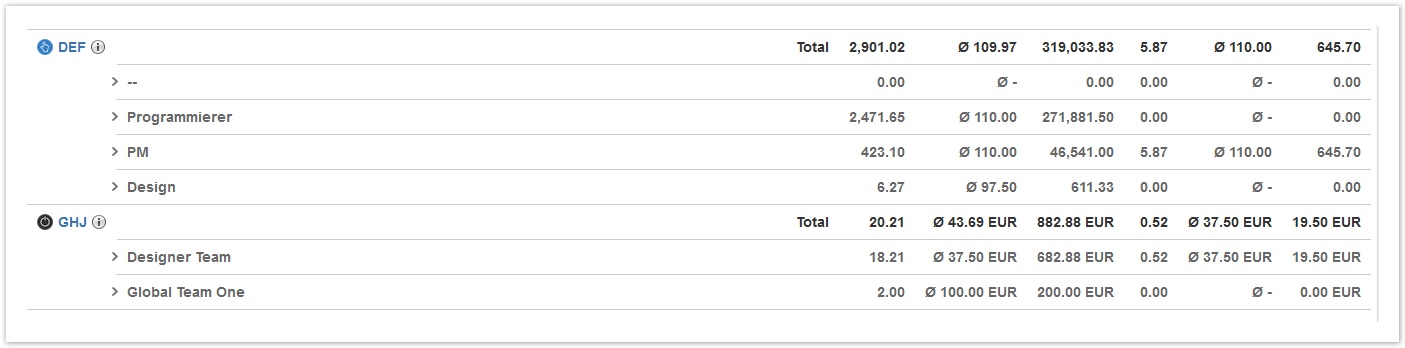
"Teams" View
By default, the summary will show the "Teams" view, i.e. data is grouped and displayed by project & teams.
Configuration Options & Operations
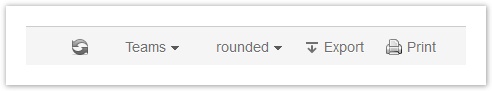
Above the list, there are a couple of configuration options and operations available:
| Option | Description | Remarks |
|---|---|---|
Refresh
| Update the financial summary if you have done certain changes on work log level. Typical changes are:
| If an update is required, the button gets red:
|
Rounding
| Option to select whether you want to see and use exact times (in decimal values) or if you want to see and use rounded times. | If no rounding rule is/was in place for the project/s selected, there will be no difference between rounded and exact. |
Display Level
| Defines how many details (in terms of rows) are displayed. Default is displaying all information by project and team. For more information, see below. | If you are analysing historic data (work logs created in JIRA before ictime was installed) or if you have decided not to work with teams & price lists in ictime, teams and price lists will display as "--". If you are not using activity types (globally or for one or more projects), "None" will be displayed. |
| Export | Option to export the summary & analysis. Also includes the accounting references, if available (see below). | Please note that the export option will always export full details of the summary & analysis, i.e, all rows, not only those that according to your current configuration are displayed to you at this moment. However, starting with ictime version 4.2.7, the .xls file will display data according to your selection in the display level dropdown (Project, User, Team, Price Lists, Activity Types), i.e. depending on the level of details you have selected in the display level dropdown, rows will be hidden in the .xls(however, data is part of the .xls file and you can display the hidden columns at any time). We use the known standard http://poi.apache.org/ to generate the .xls documents. If you experience problems opening the export files in Excel (file does not open and shows an empty screen in the Windows task bar - you might want to try to first save the file in this case) or if some cells seem not to be correctly formatted (usually wrong alignment), please use Open Office or Libre Office, it seems that certain Excel versions - sometimes - do not handle the files correctly. |
| Prints the data in a more printer-friendly style. | Please note that the print option will always print what is displayed to you.
|


Using the respective dropdown, you configure the level of details you want to see:
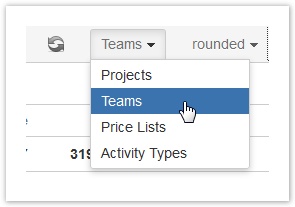
Default is "Team", i.e. data is grouped by team.
To see less details, choose "Project".

To see more details, choose "Price Lists".
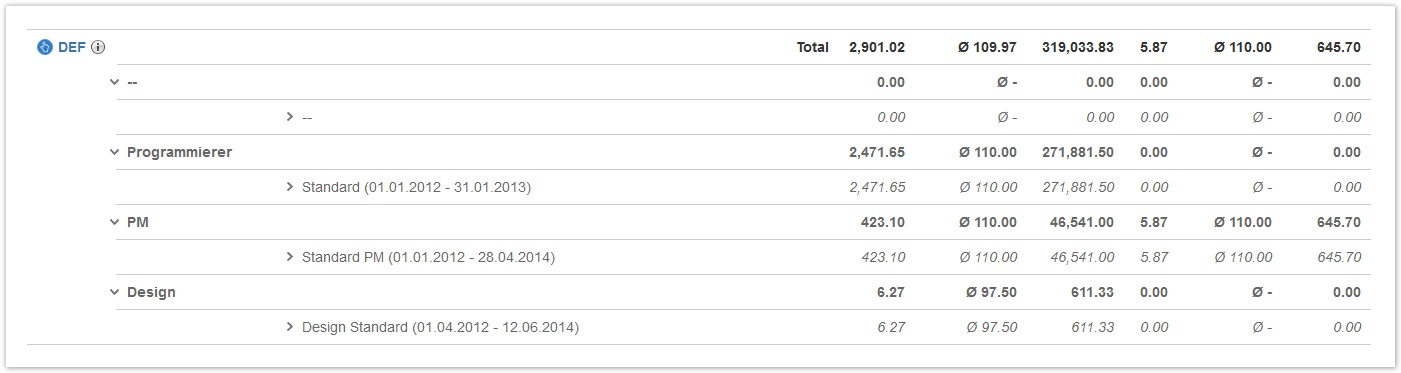
To get full details, choose "Activity Types".
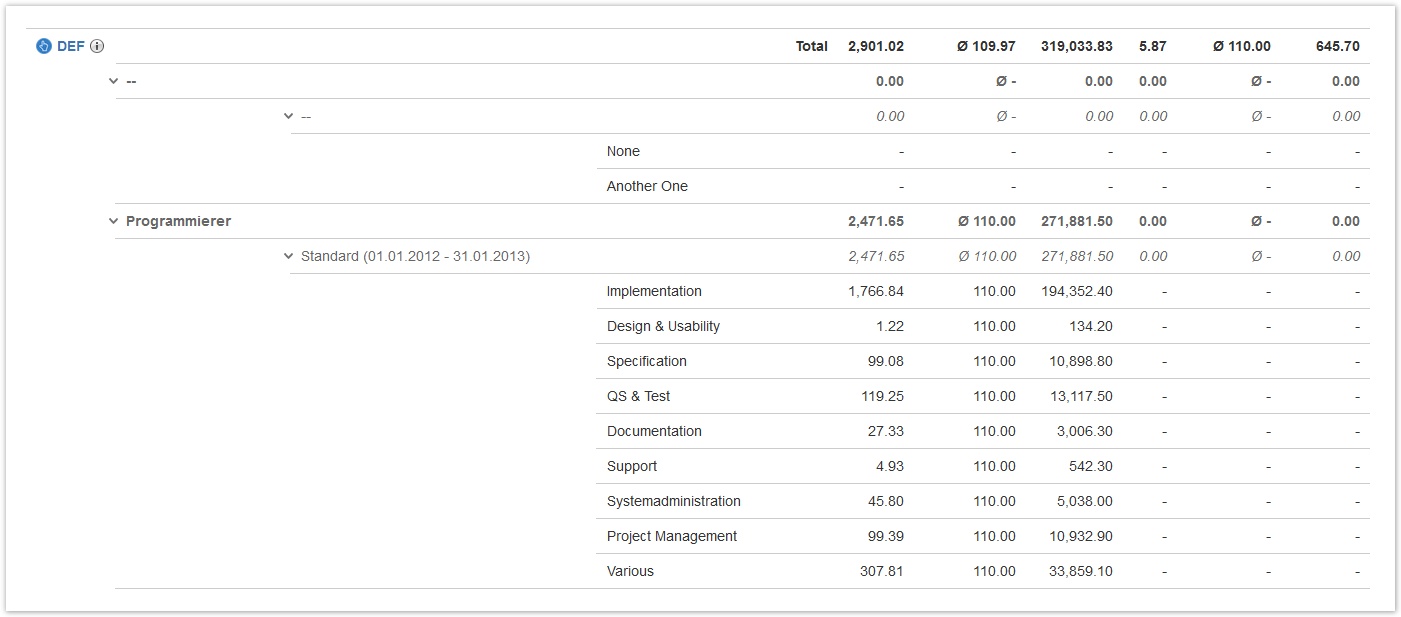
To hide/show details, you can also click on the respective rows on the level of
- Project
- Teams
- Price List.
Data
As regards the time dimension, the summary will also be available for data where no teams, price lists and activity types exist. This is either the case for historic work logs (created before you have installed ictime) or if you decide not to work with activity types, teams & price lists for some or all projects.
In the financial summary, all times are displayed as decimal values rounded to two decimal places, please note that there might be minimal rounding differences!
If you have chosen "rounded" as option for your report (and if for a project, a rounding rule had been configured), all times will be displayed according to the rounding rule.
| Column | Description | Remarks |
|---|---|---|
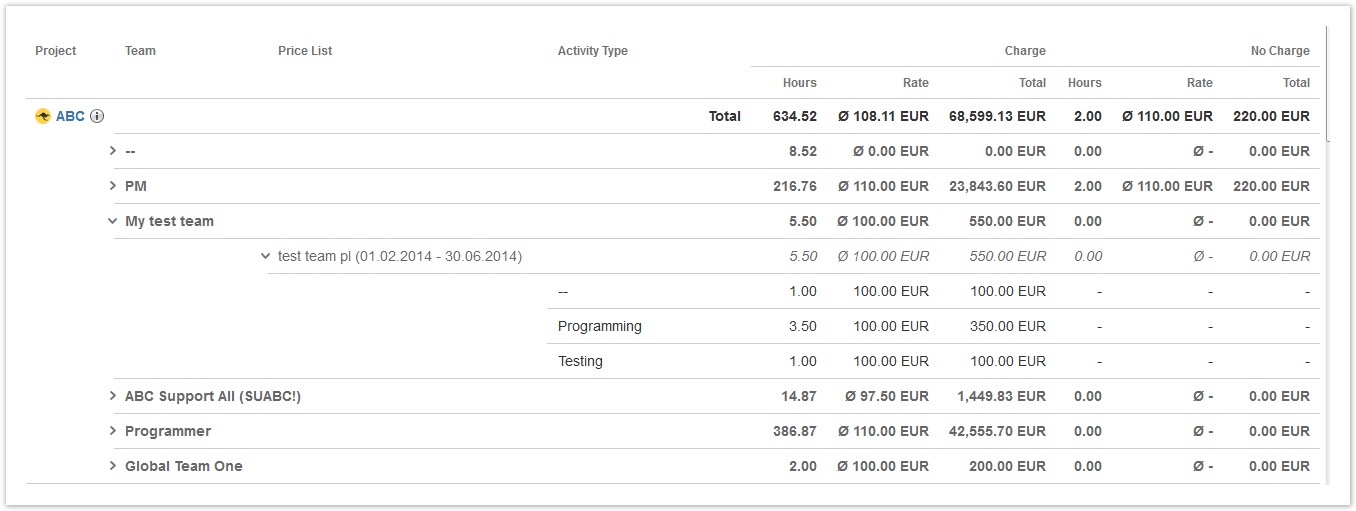
| Project | Project key. | Click on the key to get to the JIRA project summary (if you have respective permissions). |
| Team | Data is grouped by project teams. | If no team is available (e.g. historic data), "--" will be displayed. |
| Price List | Within a team, data is grouped by price list/s; name and validity period are displayed. | If no price list is available (e.g. historic data), "--" will be displayed. |
| Activity Type | Within a price list, data is grouped by activity types. | If no activity type is available (e.g. historic data), "--" will be displayed. |
| Charge | This section shows all data of work logs to be charged normally. | |
| Hours | Hours (as decimal value) | Display and calculation are either "rounded" or "exact", depending on your choice in the respective dropdwon (see above). Please note that "exact" also might include some mathematical rounding, as we are converting time data in decimal values here. |
| Price | Price per hour. | |
| Total | Sum (by project). | In addition |
| No Charge | This section shows all data of work logs with the "no charge" flag, i.e. a user has decided that this work log should not be charged (see General Configuration and Log Work). | |
| Hours | Hours (as decimal value) | Display and calculation are either "rounded" or "exact", depending on your choice in the filter definition (see above). Please note that "exact" also might include some mathematical rounding, as we are converting time data in decimal values here. |
| Price | Price per hour. | |
| Total | Sum (by project). |
On the level of project, team and price list, there is always a separate row that totals all amounts of hours as well as the financial dimension of the respective project, team or price list.
There will be no specific information in the summary if work logs are included where a user has decided to use the "Corrected time" feature (see General Configuration and Log Work). In this case, the "Charge" section of the summary simply contains the corrected time as decimal value. You can see in the work log details of the report if there are work logs with a corrected time (see Reports: Work Log Details).
If issues with work logs have been moved between different projects in JIRA, this will create inconsistencies in ictime relations to teams, price lists and activity types and needs correction (see Fix Work Logs (Warnings)). As long as this is not done, these inconsistencies will get visible in the summary of reports. If an issue with work logs has been moved from project A to project B, when looking at the summary of project B, you will see teams and price lists or activity types that belong to project A.
Accounting References
If you have configured accounting references for your project (see Project Accounting References), they will be available via a small info icon next to the project key.
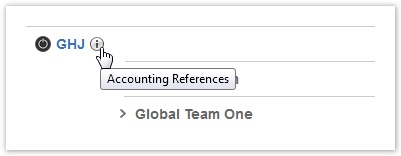
Click on the icon to see the references:
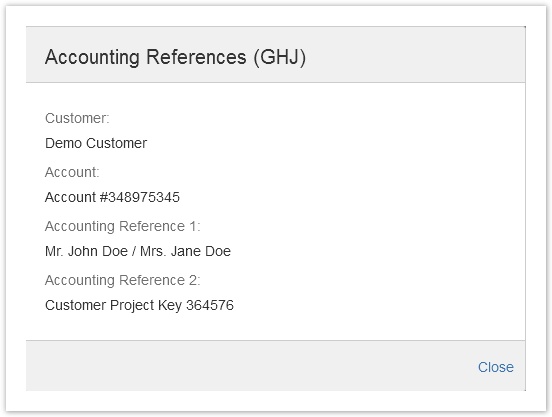
If no accounting references have been set, there will be no icon.
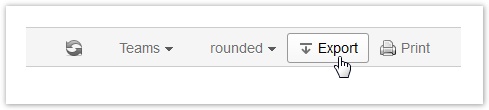
Export Summary
You can export the summary as .xls file via the respective button in the navigation bar:
Apart from the summary data, your export will contain your accounting references, if applicable (see above and see Project Accounting References).
If you have chosen multiple projects, the accounting references won't be included in the export.
"User" View
The "User" view works exactly like the "Teams" view, with the only difference that as additional criteria, data is grouped by users:
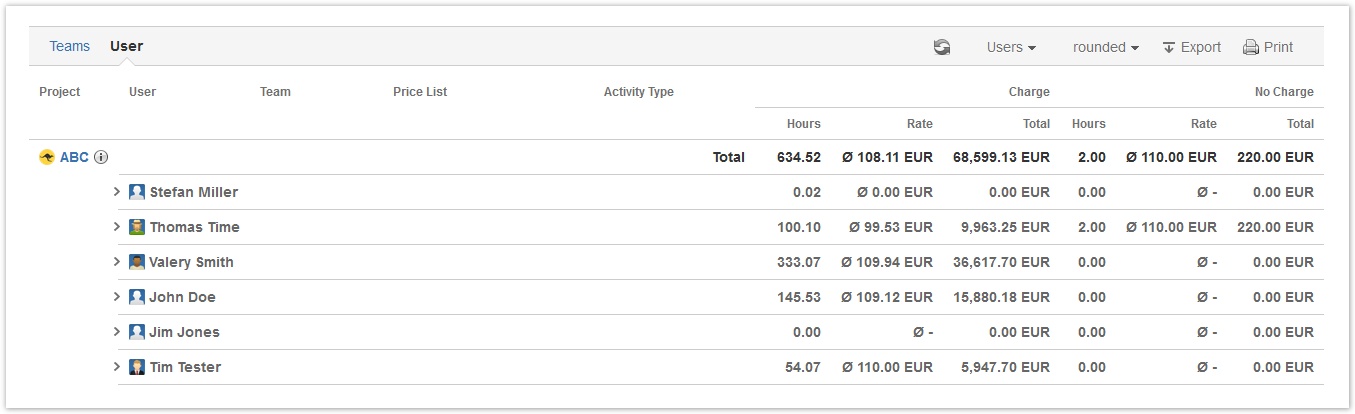
You can analyse data for each project by user, and for each user by team, price lists and activity types.